Determining the occupancy of components in models
Components in a model typically represent the locations of specific molecules or complexes in a density map. In some cases these locations may be expected positions for these components, but whether they are occupied or not needs to be determined. The algorithm here makes used of refining the locations of the components by cross correlation with a suitable template. The density around each location is then assessed by calculating the number of voxels above an expected threshold. This gives the coverage, defined as the number of voxels above the threshold divided by the total number of voxels with a spherical radius of the component location. The threshold is typically calculated from the molecular weight of the particle in the map, or as default set to the sum of the average and the standard deviation.
Preparation
The input for occupancy determination requires a model parameter file with the components defined. For different cases the prearation steps may vary:
Simple case
The components in the models have been created and correspond to densities or features in the associated maps. The occupancy determination can proceed without modification.
Particles from a 3D reconstruction
The particles have been extracted from a 3D reconstruction and need to be converted to models:
brecmod -v 1 -outmodel test_mod.star test_rec.star
In the case where the particles have been oriented with respect to reference map (see 3D SPA), the particles can be oriented in the same way as the reference map during the conversion with the -images option:
brecmod -v 1 -images -outmodel test_mod.star test_rec.star
Occupancy estimation
Reference template for component location refinement
The template is typically a sphere with a soft edge of the appropriate size of the component:
beditimg -v 7 -create 12,12,12 -sampling 7.8 -origin 6,6,6 -sphere 6,6,6,3 -fill -1 -edge 0.5 template.pif
Reference model for defining component locations
In some cases the locations of components are at defined positions within particles (such as proteins within an icosahedral shell). If the particles are correctly oriented, a reference model can be used to define the component locations of all the models.
To generate a model with a component located on the 3-fold axis of an icosahedron, 104 Å from the center, use the following:
bmodedit -v 7 -type dod -dist 104 -comp 15.6 -out ref_model.star
Running the occupancy determination
The occupancy is then determined with a command line such as:
dcount -v 1 -model ref_model.star -comp 15.6 -template template.pif -shift 55 -resol 50,500 -invert -mass 12.645M -cutoff 50 -bins 20 -fit 2 -output test_occ.star -Post test_occ.ps test_mod.star
The component location refinement uses the options -template, -shift and resolution.
For occupancy determination, the maps have to have positive density (higher values = higher density) Therefore, maps coming from cryo-electron tomograms need to be inverted (-invert option).
The -componentradius option defines the spherical shell around a component for calculating coverage and ensuring that neighboring components don't overlap. The -mass option sets the threshold used for calculating coverage. The -cutoff option determines the fraction of coverage above which the component is considered occupied. The -bins option determines the number of histogram bins in the Postscript output. The -fit option sets the number of binomial curves that with be fit to the distribution of occupancies for all the models. Uncertainty of the distribution of occupancy (1 std) is estimated using different fractions of coverage within the ±0.2 interval around the fraction specified in the -cutoff option.
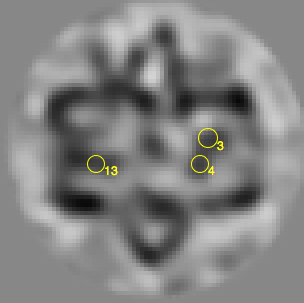
For assessment of the component locations, the model maps can be concatenated into one multi-image file and opened in bshow:
bmodedit -v 7 -catenate map_all.pif -out test_occ_all.star test_occ.star
bshow test_occ_all.star &
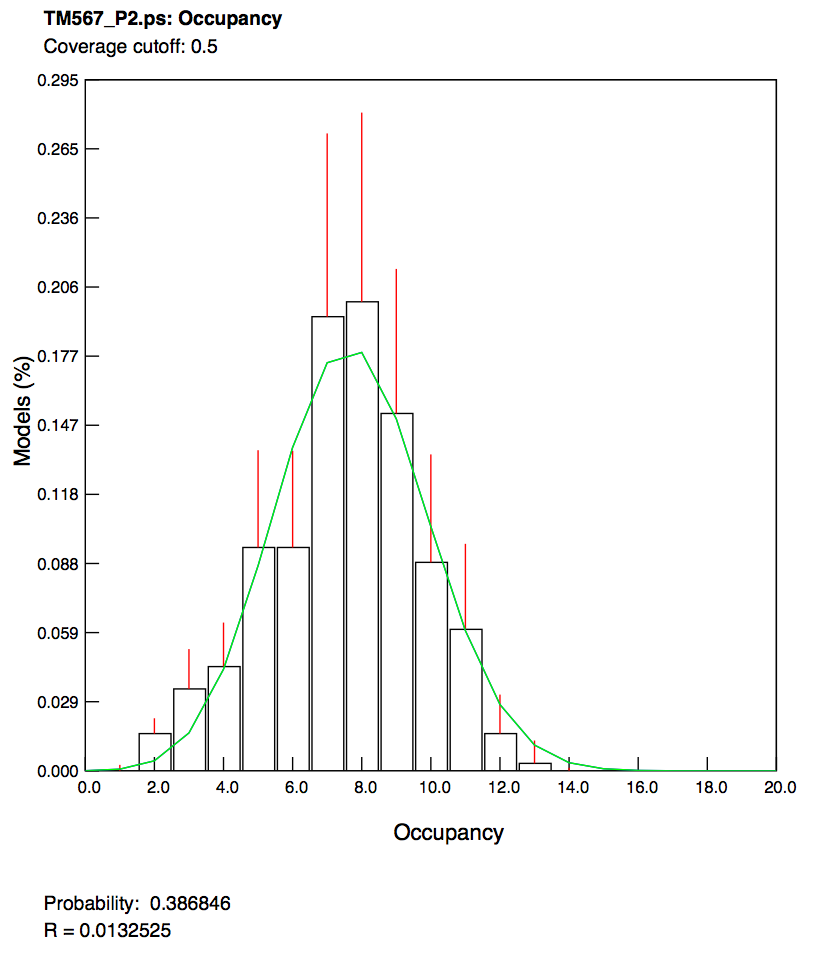
Results for an example
The output model can be examined in bshow and the assignment of component occupancy verified. The markers that indicate the occupied locations can be selected by setting the FOM cutoff in the Model window to the fraction of coverage used for classification of occupancy. In the example shown below, a protein within the bacteriophage f6 procapsid occupied a fraction of 20 possible locations. Tomography was used to visualize these procapsids and identify which locations were occupied by the protein.
For each procapsid, the number of occupied sites were counted, and a histogram constructed to show the distribution of the number of proteins in procapsids. This was then fitted to a single binomial distribution.