Correlated mutation analysis
The correlated mutation analysis follows the method set out in Gobel, Sander & Schneider (1994) Proteins 18, 309-317, with a few minor differences.
The mutational correlation between two positions i and j in the alignment is defined as:
sum(w(k,l)*(s(i,k,l) - <s(i)>)*(s(j,k,l) - <s(j)>))r(i,j) = ------------------------------------------------
m^2*o(i)*o(j)
where:
m: number of sequences
o(i): standard deviation of similarities at alignment position i
w(k,l): weight for sequences k and l
(1 - fractional identity: see function seq_aligned_identity)
s(i,k,l): similarity for alignment position i between sequences k and l
<s(i)>: average similarity at alignment position i
Example:
bcormut -verbose 7 -datatype b -image vp23.jpg -cutoff 0.6 vp23.pir
Output with high-scoring correlations:
Res1 Num1 Res2 Num2 Total CorrT 9 I 17 210 0.631 TAIIIVVVIVVVIVIIIIIII IILLLLLLLLLLLLLLLLLLL
T 104 D 115 210 0.610 TTTTTTTTTTTTTKVAVVVKT DDDDDDDDDDDDDGTSTSTID
Q 26 S 136 210 0.623 QQQQQQQQTSCCCQQQQQQQQ SSSSSSSSLVLLLSSSSSSSS
L 44 S 136 210 0.602 LLLLLLLLHSSSNVIILLLLV SSSSSSSSLVLLLSSSSSSSS
S 136 I 230 210 0.610 SSSSSSSSLVLLLSSSSSSSS IIIIIIIIASAAALVIIILLV
Correlations reported: 5
Each high-scoring correlation (above the threshold of 0.6 given with the "-c" option) generates three output lines. The first line contains 6 values with the first 4 values giving the types and alignment positions of the correlated residues. The residue types indicate those in the reference sequence (typically the first sequence in the alignment, but can be set on the command line). The next value is the number of comparisons made: maximally m*(m-1)/2. The last number is the correlation coefficient.
The next two lines gives the corresponding residues at the two alignment positions for all the sequences, allowing the user to see on what basis this is a high correlation. Often, poorly represented pairs of positions score high and these should not be used to reach any conclusions.
Output image:
The image, "vp23.jpg", generated in this example represents all the correlation coefficients calculated for all the positional pairs in the alignment:
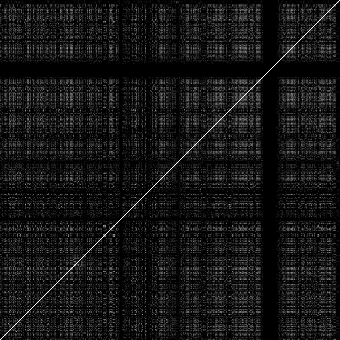
The line across the diagonal is the comparison between identical sequences (i.e., i = j). The homogenous band towards the right represents a part of the alignment with large gaps for most of the sequences.