Background
There are at least three steps to a tilt experiment:
- Record a tilt-pair of micrographs, where the second view is of the same field as the first, but the specimen was rotated by a known angle (rotation angle) about a known axis (tilt axis).
- Determine orientations (views or Euler angles: phi, theta, psi = -omega) and origins and then a reconstruction from the first view. At a minimum, the origins of the particles in the second view must be determined. (The second view can be included in the reconstruction - after orientations and origins are determined of course.) Chiral features should be apparent in the reconstruction. The handedness of this structure is termed "hand A". The mirror of this structure is "hand B".
- Compare projections of each handedness to images of the
second view. In the program dhand, the following steps are performed:
- The input three-dimensional, hand A map is mirrored to give the hand B map: mapB(x,y,z) = mapA(-x,-y,-z).
- 180 degrees is added to each view angle (or equivalently the omega or psi angle). This gives the orientation for hand B.
- Two predicted orientations for the second view are computed from the first orientation and the known tilt-axis direction and rotation angle. One predicted orientation corresponds to the expected second orientation if the structure has handedness A. The other corresponds to the expected second orientation if the structure has handedness B. For the hand A orientation the program uses the original view angle. For the hand B orientation the program uses the orientation view angle + 180 degrees. The effect of this is to rotate opposite directions about the tilt axis - as far as the view vector ( or equivalently the phi, theta Euler angles) are concerned.
- The hand A map is projected in the predicted hand-A orientation (for the second view).
- The hand B map is projected in the predicted hand-B orientation (for the second view).
- The hand A and hand B projections are compared to the image of the second view. A correlation coefficient (CC) is computed for each comparison. The correct handedness will have the highest CC. (Note: Before the test is considered reliable, there should be a significant gap between the hand A and hand B CCs. What is reliable will depend on the specimen and the quality of the images.)
- As a control, the hand A map is projected along the hand A orientation of the first view. This projection is then compared to the first image. This resulting CC should be a similar value to the CC from the correct handedness in the previous point.
For a detailed discussion of the handedness-tilt experiment, please see Belnap et al (1997) "A Method for Establishing the Handedness of Biological Macromolecules" J. Struct. Biol. 120, 44-51
Running dhand
To run dhand you need the following:
- Particle images from the first and second views. Particle image numbers must match between the two micrographs, i.e. the id numbers in micrograph pairs must represent the same imaged object. Note, the two images must be kept in the same view direction (i.e. the same x,y orientation) when displaying, storing, extracting, and manipulating in the computer. For example, if you scan negatives you should place the two micrographs in the scanner in the same orientation.
- A three-dimensional reconstruction computed from the micrograph of the first view. (There is no reason the second view cannot be included in the reconstruction as well if the orientations and origins are sufficiently well determined.) For a reliable detection of the correct absolute handedness, the reconstruction needs to be of sufficiently high quality that you can see chiral features (handedness) in it.
- Orientations and origins of particles in the first view, and at least origins of particles in the second view (orientations are okay, too).
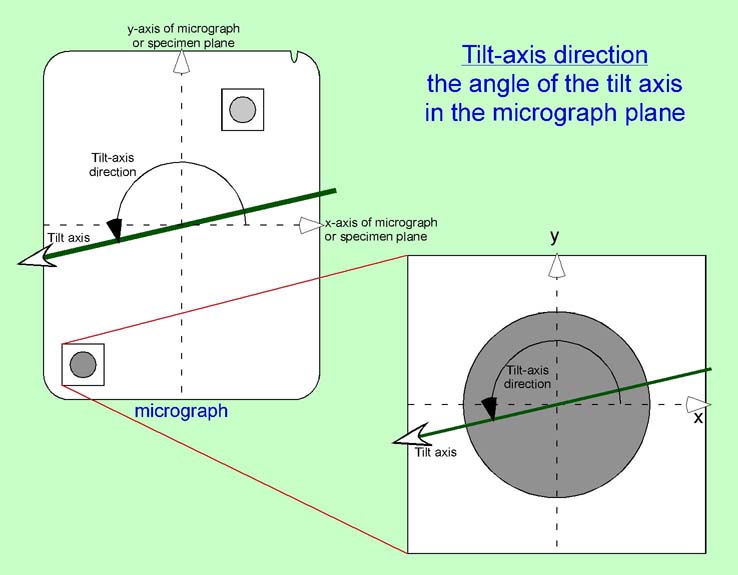
- The angle of the tilt axis in the image plane (tilt-axis direction). This angle is measured from the +x-axis of the orientation of the micrograph in the computer (see diagram). A positive angle is a anticlockwise rotation.
- Tilt angles for each view. The tilt angle is the angle of the specimen in the microscope. For example, if the first view was taken with the microscope goniometer at 0 degrees and the second at 5 degrees, then the tilt angles are 0 and 5 for the first and second views, respectively. The angle of rotation is tilt_angle2 - tilt_angle1. It is critical that the tilt and the tilt-axis direction angles be set properly otherwise the incorrect handedness may be chosen ( see diagram). For this reason, it is recommended that you use ahandedness calibration standard - a particle with known handedness - to calibratethe tilt-axis direction and tilt angles. A standard should be used at every magnification and microscope used since the tilt-axis direction changes with changes in magnification or instrument.
- Radial and resolution limits for the correlation-coefficient calculation, in pixel and angstrom units, respectively.
- Input parameters in a parameter file (such as a STAR file), see example Multiple micrograph pairs can be entered. The micrographs must be correctly organized in field-of-view records, each containing exactly 2 micrographs of the same field-of-view.
- The spacing in angstroms/pixel must be correctly set in the parameter file.
The tilt axis convention
Example command lines
To view the options avaialabe for the program dhand, just enter "dhand".
Given two micrographs in two parameter files, it can be properly organized using the -numberperfield option. The tilt angle and tilt axis should be specified in the parameter file, but the -axis option can override the angle for the tilt axis. The other requirements are the micrograph selection (-mgsel) and the reference map (-map):
dhand -v 1 -num 2 -axis 90 -mgsel angle,0,10 -mindif 0.02 -map d5.map d5_proj.star d5_roty10_proj.star
If more information about each particle is desired, the -difference option can be used:
dhand -v 1 -diff 1 -num 2 -axis 90 -mgsel angle,0,10 -mindif 0.03 -map d5.map d5_proj.star d5_roty10_proj.star
If the origins of the second set of particle images are not well defined, they can be determined using the option -org2:
dhand -v 1 -org2 cross -num 2 -axis 90 -mgsel angle,0,10 -mindif 0.03 -resol 4,200 -map d5.map d5_proj.star d5_roty10_proj.star
Sample output for a test with murine polyomavirus
dhand, version 2001-10-18Total number of micrographs: 2
Total number of particles: 61
Tilt pair
poly_5122.pif
poly5123.pif
Tilt-axis direction = 113.500 Rotation angle (tilt_angle2 - tilt_angle1) = -5.000
Particle images vs. projections
Correlation Coefficients
projection projection
projection
view 1
view2,handA
view2,handB
Particle_Id
vs. image1 vs. image2
vs.
image2
================================================================
2
0.4206
0.3559
0.1399
3
0.3896
0.3354
0.1670
4
0.4481
0.3817
0.1612
5
0.4178
0.3675
0.1155
6
0.4620
0.3647
0.2844
7
0.4171
0.3803
0.1356
8
0.4146
0.3400
0.1925
9
0.3624
0.3721
0.1674
10
0.4258
0.3838
0.1240
11
0.4803
0.3310
0.1159
12
0.4524
0.4156
0.1735
13
0.4301
0.3405
0.1247
16
0.3839
0.3482
0.0307
17
0.4359
0.3881
0.2008
18
0.3944
0.3550
0.1037
19
0.3994
0.3581
0.1494
22
0.4113
0.3542
0.1109
24
0.4425
0.4033
0.1467
29
0.4380
0.4038
0.1486
Tilt-pair
average
0.4224
0.3673 0.1470
Tilt-pair std. dev
0.0290
0.0245 0.0503
Pair
Count
19
0
Particle images vs. projections
Correlation Coefficients
projection projection
projection
view 1
view2,handA
view2,handB
Particle_Id
vs. image1 vs. image2
vs.
image2
================================================================
Global
average
0.4224
0.3673
0.1470
Global std.
dev
0.0290
0.0245
0.0503
Global
Count
19
0
NOTE: Hand A is handedness of input map.
Mirror of input
map is hand B.
(for multiple micrograph pairs the global results would
represent all
pair-wise comparisons)